CMU Robotics Archive
CMU’s The Robotics Project has devoted the past few years to capturing the history of the university’s robotics research, working toward the launch of their Robot Archive, which serves as a digital collection available to a wider audience. Given this, my role was to create a visualization tool based on the metadata to engage members of the community with or without interest or experience in robotics. This visualization project serves as an initial step to represent the interconnected relationships between projects, people and real-life applications by employing data wrangling and data storytelling techniques.
Data Collection
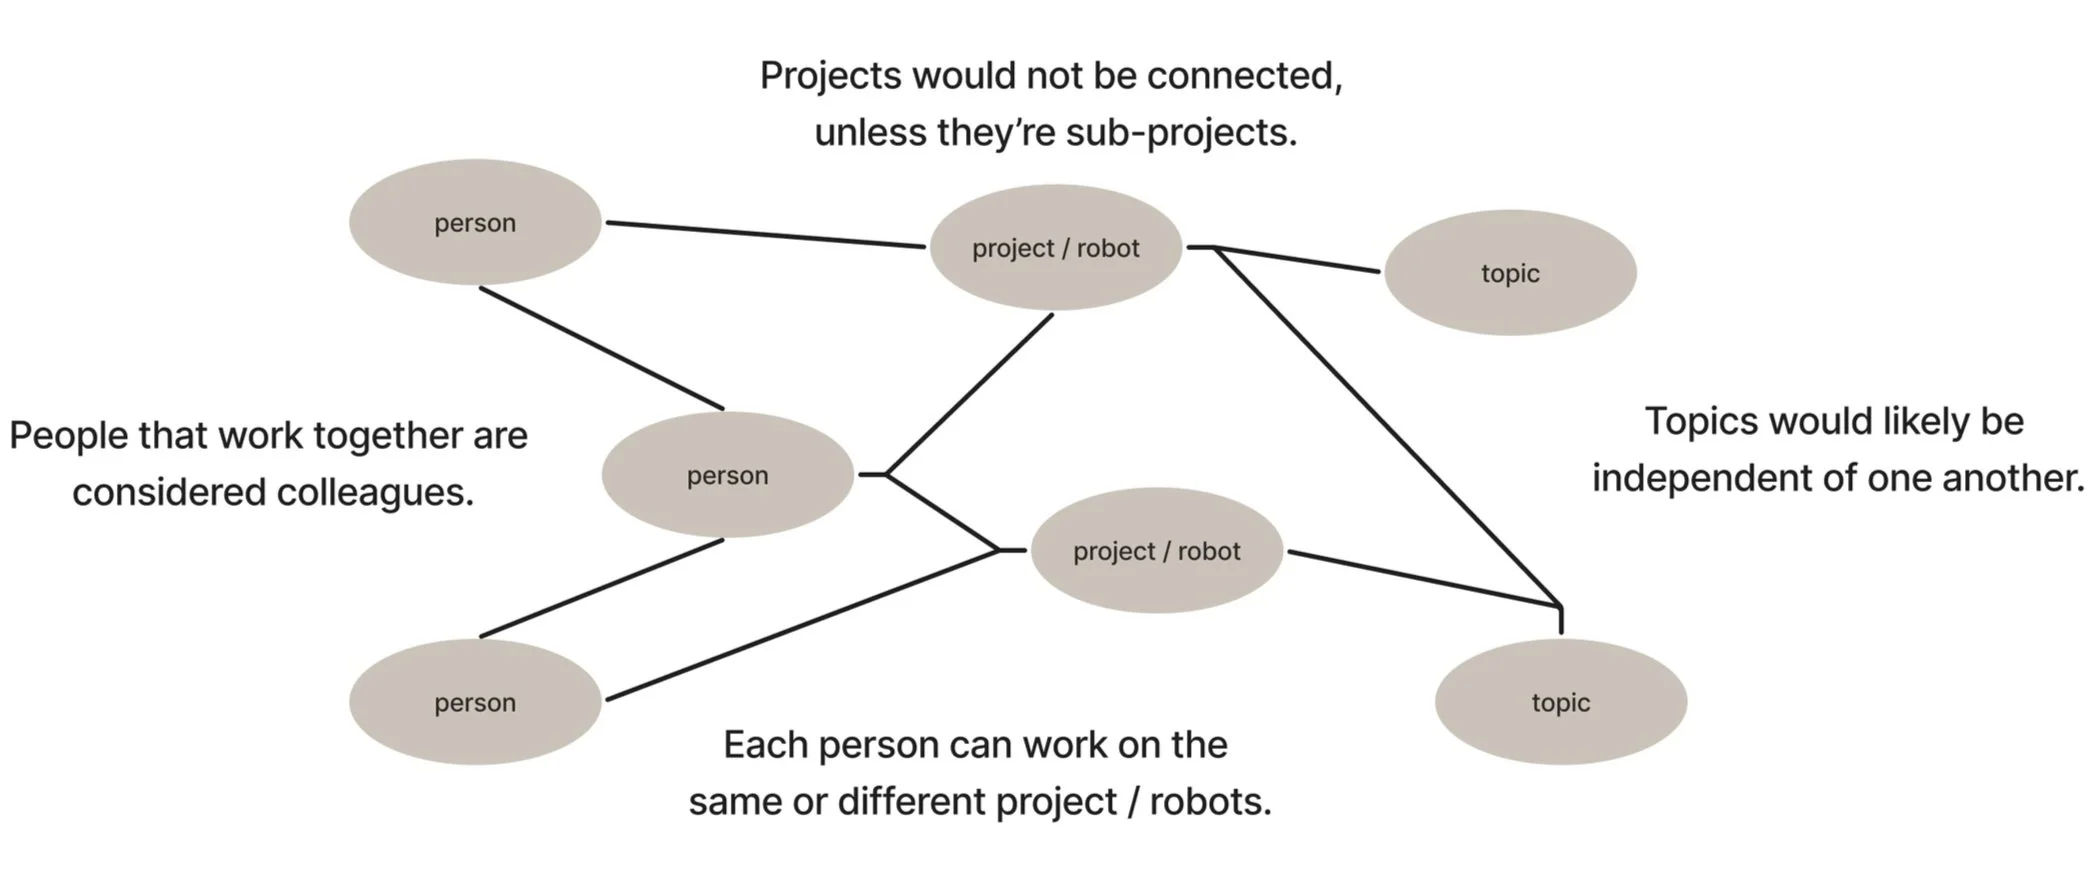
The metadata utilized in this project was derived from CMU’s Robotics Institute’s Research Reviews, which were digitized as a part of the Robot Archive. As these documents were recorded certain relationships became more distinct, such as the relationships between the people, or colleagues, that contributed to the same robotics projects, and recurring research topics that related to the projects (example included below). As the data collection phase came to a close we decided to focus the project on the people, projects, and topics, which is captured in the early sketch of metadata’s relationships included below.
Figure 1. Research Review published in 1984.
Figure 2. Visual representation of relationships based on the metadata.
Data Modeling
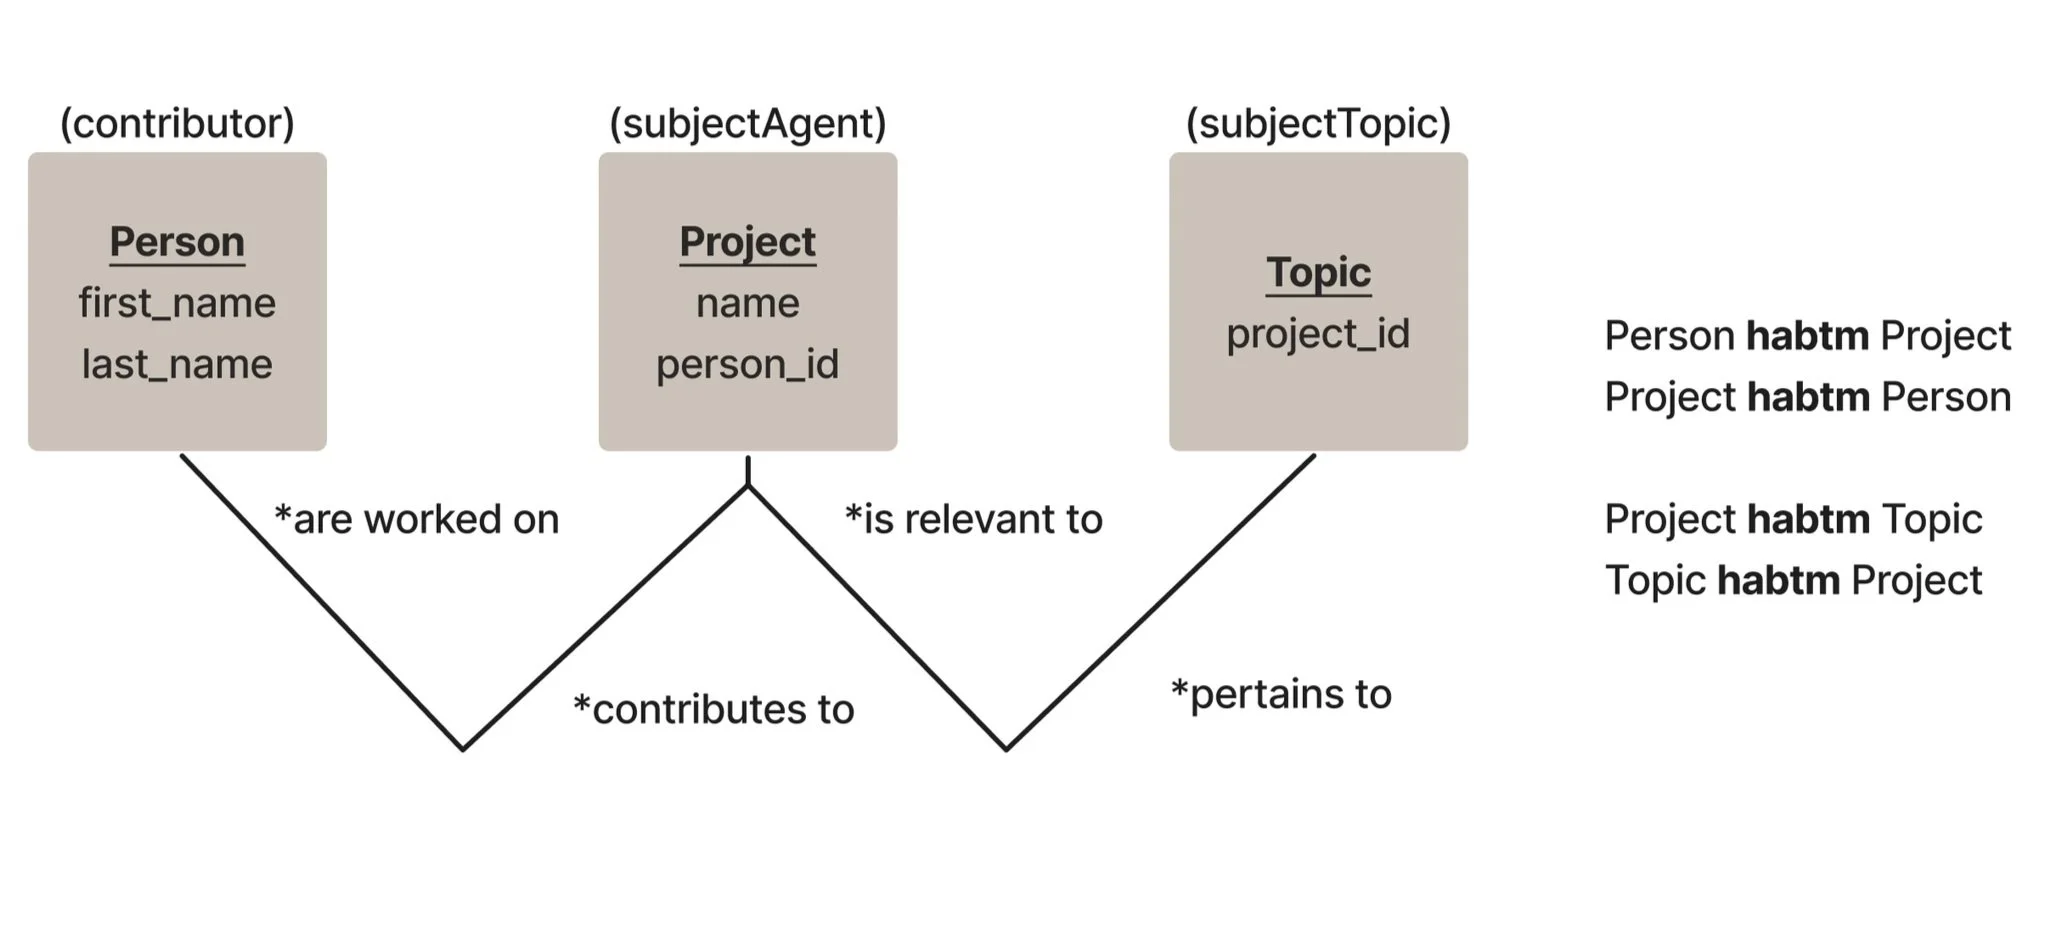
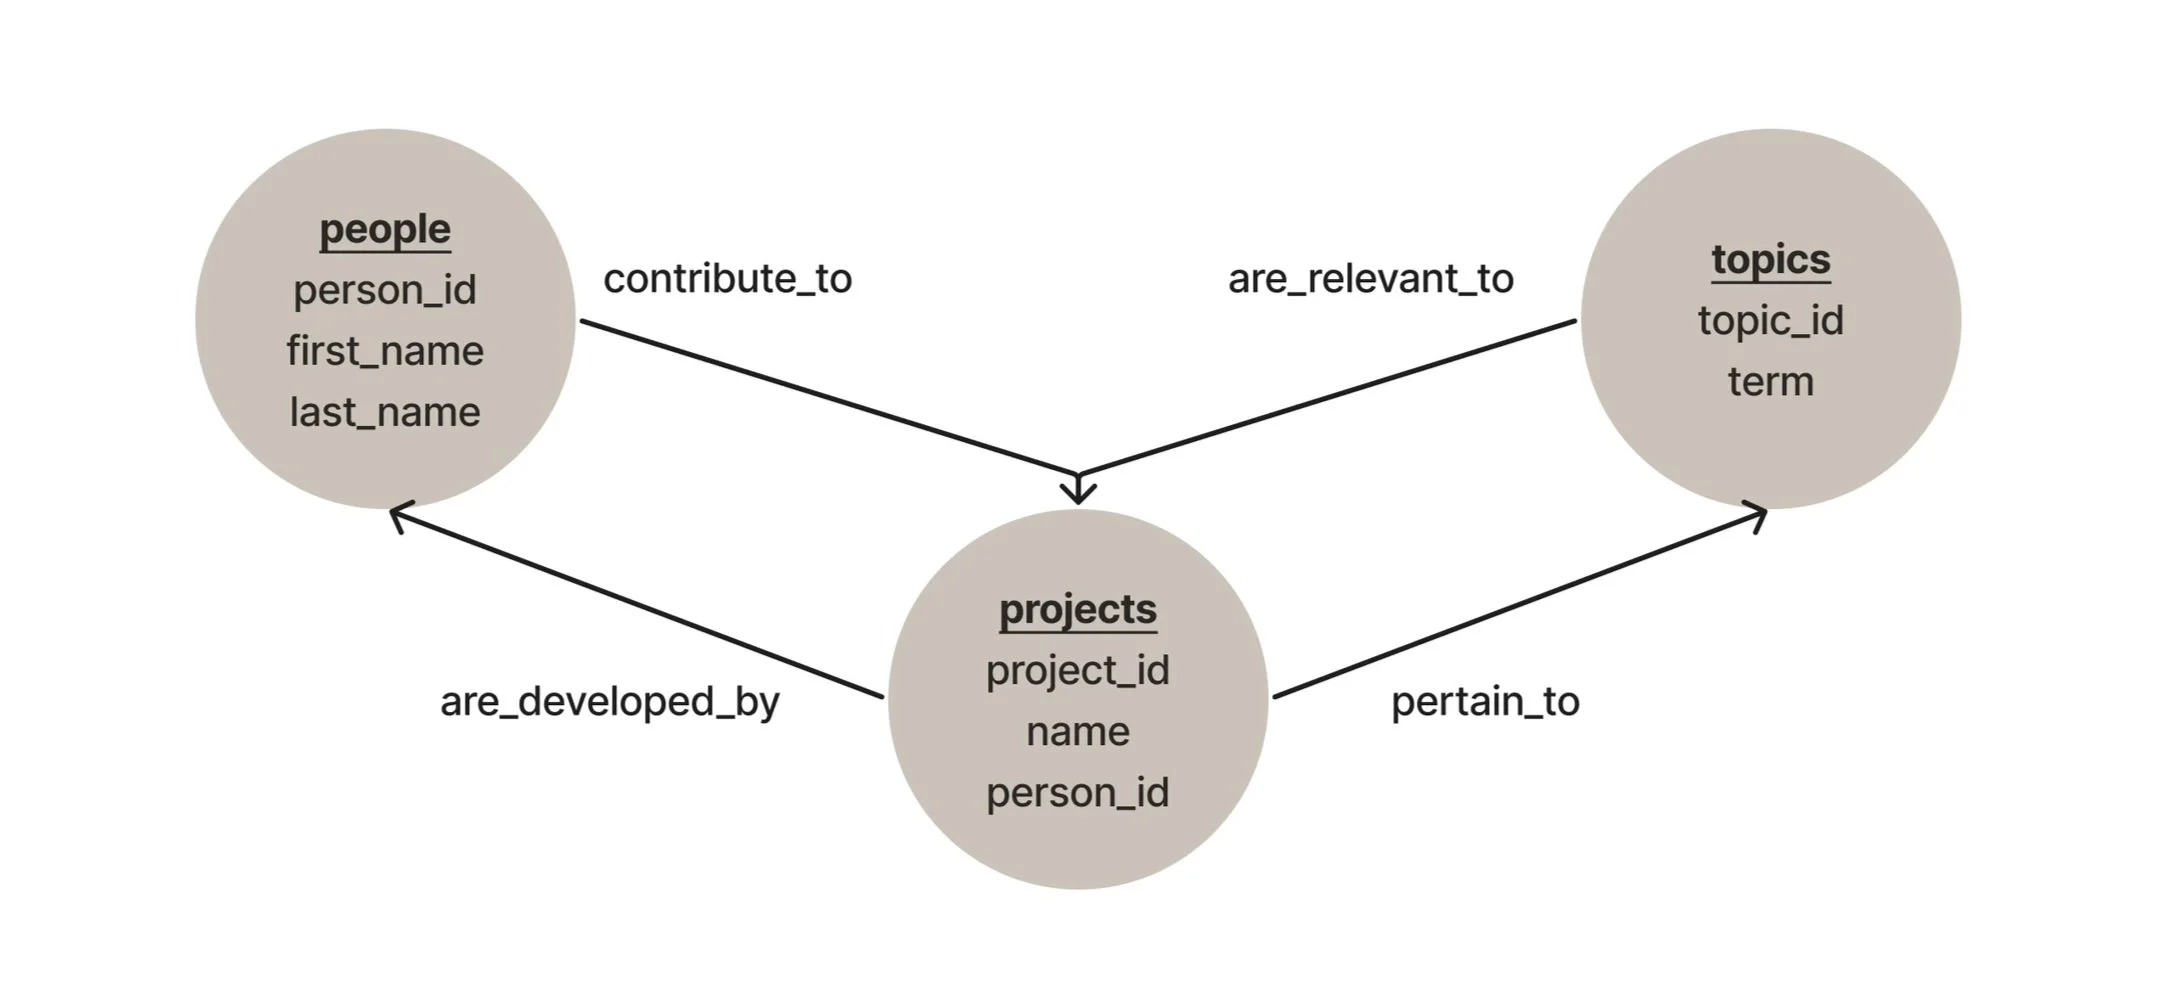
Following data collection, the lead archivists and I contemplated whether the data would be represented in a more traditional graph or chart, but based on the complex relationships between people, projects and topics we determined that a network graph would best depict the information derived from the reviews. Because of this the data model for the visualization resembles more of a graph model rather than a traditional relational database.
Figure 3. Entity Relationship Diagram and Relational Vocabulary
Figure 4. Basic graph model.
Data Transformation
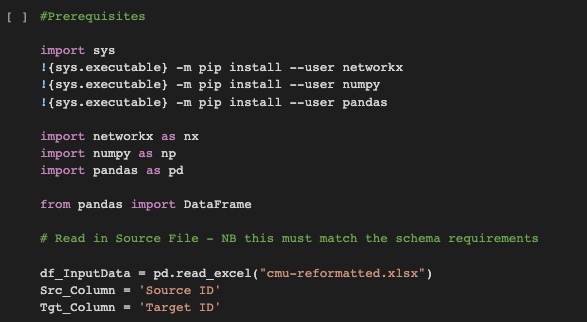
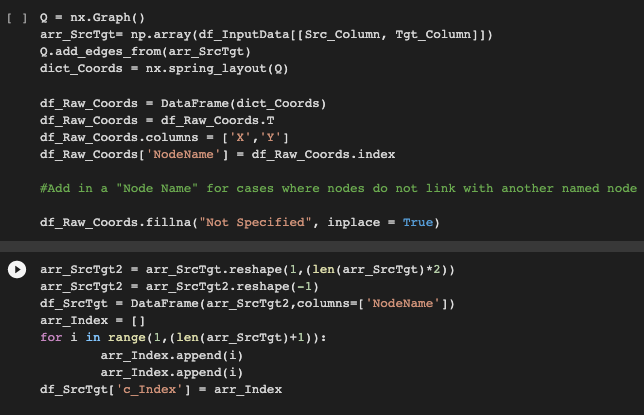
Once we determined the data model, I transformed the data from its tabular form into a format that better depicted the network relationships. This required the use of a specific Python script derived from an example published by Tiny Viz Talks that utilized NetworkX to reformat data for network graphs in Tableau. Their work was based on “Exploring Network Structure, Dynamics, and Function Using NetworkX” from Proceedings of the 7th Python in Science Conference (SciPy2008) (Aric A. Hagberg, Daniel A. Schult and Pieter J. Swart).
Figure 5. Examples of Python script used for this project.
Data Visualization
The visualizations created in Tableau were separated based on a potential area of interest (i.e. research topic, robotics researcher call out, specific research projects). Click here to access the full collection of visualizations based on the CMU data.
Project Learnings
It’s important to be able to receive input and feedback from stakeholders as they are likely most familiar with the data.
This project helped me to see how various data analysis tools work together throughout the analysis and visualization process.
With more time it would have been beneficial to receive more input from the project community, as well as from people less familiar with robotics.
Taking into consideration what can be realistically maintained by an organization is essential to a successful, long-term project.


